

This report was published in April 2012.
I’d like to present a theory that I’ve developed in recent months, though I must emphasize that this is a theory for now and not yet an outright prediction. The scenario that I will discuss is indeed probable and realistic enough to warrant vigilantly monitoring the global economic situation to see if it unfolds according to the framework that I have laid out in this report.
My hypothesis is that the world may be on the verge of a massive economic bubble boom that could come out of left field and take the whole world by surprise.
My basis for this coming bubble boom hypothesis comes from my justifiably skeptical understanding of how central banks such as the U.S. Federal Reserve work and their role in creating economic boom, bubble and bust cycles. In simple terms, central banks are entities that are independent of governments that have been given the responsibility of managing a nation’s currency and determining the cost, in the form of interest rates, of money that is borrowed from the nation’s banks. Central banks manipulate interest rates for the purpose of guiding a nation’s economy through business cycles with a minimal amount of economic risk and inflation, though it rarely works this way in practice. Quite the opposite of their purported intention, central banks’ management of the business cycle is notorious for creating wild economic swings, extreme economic distortions and speculative manias, such as the late 1990s Dot-com bubble and the disastrous mid-2000s housing and banking bubble. A truly free-market monetary system without a central bank altogether would result in a far more stable and organic economy.
Central banks guide the business cycle by raising or lowering the cost of borrowing from a nation’s banks; when the economy is too slow such as during a recession, central banks lower interest rates for the purpose of stimulating borrowing and jump-starting economic growth. When economic growth becomes too rapid and results in excessive and risky borrowing and inflation (such as during the peak of the U.S. housing bubble), central banks try to slow the economy and inflation by increasing borrowing costs and reining in the growth of credit. The process of reining in credit growth often results in an abrupt economic slowdown or “hard-landing,” which is what happened after the Dot-com and housing bubbles were “pricked” by the U.S. Federal Reserve. Upon an economic slowdown or recession, central banks ease credit conditions and start the cycle all over again.
Central Banks Can Create Economic Growth, But It’s Bubble-Based Growth
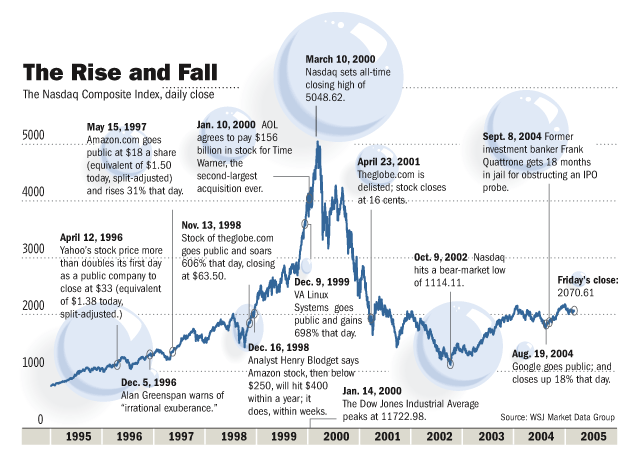
Central bank manipulation of the business cycle is nothing short of artificial market interference and, while central banks usually nominally accomplish their goal, the end result is an artificial business cycle that is extremely prone to creating economic bubble booms rather than sustainable economic growth. The powerful economic shocks caused by the popping of the Dot-com bubble and the September 11th 2001 terrorist attacks spurred the U.S. Federal Reserve to slash interest rates from 6.5% to 1%, a four-decade low, to prevent the country’s economy from plunging into a deep recession. While extremely low interest rates assuaged financial markets (partly because low rates forced fixed-income investors into riskier assets like stocks), the economy experienced an unusually-anemic “jobless recovery” until approximately mid-2004.
By mid-2004, ultra-cheap credit and therefore mortgages caused a decade-old bull market in housing prices to soar in a parabolic fashion, creating an explosion in housing-related economic activity and demand for construction workers, mortgage brokers and realtors. (It was around this time that I built my first website to warn millions of people of the housing & banking bubble.) As the housing bubble-based recovery accelerated, newly-employed workers and suddenly-rich homeowners started spending money very freely, in turn creating more jobs and economic growth outside of the housing sector. Economists, business leaders and politicians alike cheered-on the recovery largely unaware that the economic growth was built on the back of an unsustainable bubble that would pop disastrously a few years later. Central banks are certainly able to spark economic growth by providing large quantities of cheap credit, but the growth is most likely to occur in the form of economic bubbles that pop even harder in the end rather than true organic economic growth. (I call this phenomenon a “bubblecovery” = a “bubble recovery.”)
Central banks, through their blunt tools of monetary policy, are constantly creating new economic bubbles to replace the last bubble that popped; they created the housing bubble to replace the Dot-com bubble and you had better believe that they are actively inflating another bubble (or bubbles) as we speak to replace the housing bubble. As one of the first people to have spotted and warned on a large-scale of the nascent housing bubble in 2004, I have to say that I see many parallels between the late-2003/early-2004 period and the first few months of 2012. Both time periods were approximately 2.5 years after a recession had officially ended (the first recession ended in November 2001, the second recession ended in June 2009) and both came on the heels of tepid “jobless recoveries.” Both periods also occurred after several years of economic “deep-freeze” and strongly negative public sentiment, contrasted with an extremely confusing and seemingly-unwarranted rise in stock prices (partly due to low interest rates forcing investors into riskier assets like stocks). Last but certainly not least, both time periods were marked by extremely stimulative monetary policy courtesy of central banks (this topic will be greatly expounded upon shortly).
With all of the parallels between the early-2004 and early-2012 periods, the only element that I haven’t yet mentioned is today’s housing bubble-equivalent that will come out of left-field and surprise the world by generating economic growth, new jobs and eventually result in economic euphoria again. I strongly believe that I have identified this Next Bubble – except that there are eight of them this time around. These bubbles are: China, Commodities, Canada, Australia, College (U.S.), Healthcare (U.S.), Emerging markets & Social media and I’ve developed an acronym to help easily remember them, “CCC Aches.”
As with housing in 2004, the “CCC Aches” booms/bubbles have already boomed for a decade (the housing boom started in the mid-1990s (see chart), the “CCC Aches” boom started in the early-2000s) and have been the major contributors to economic growth and job creation through the recession. The very recovery from the Great Recession is due in a large part to the continued growth of the “CCC Aches” bubbles. Just as economists were cheering on the home construction boom and all of the new construction jobs that it created during the last bubble, economists are now cheering on the U.S. medical building boom and the incredible number of new healthcare jobs that are being created. By sending a “false signal,” central bank-fueled bubble booms trick nearly everybody into believing that they are legitimate and sustainable “engines of growth.”
After a decade of steady growth, the housing boom experienced a final explosive phase starting in 2004 (see chart), catalyzed by a thawing post-recession economy and abundant quantities of extremely cheap credit. My hypothesis is that the “CCC Aches” bubbles may soon experience a mania phase of their own due to very similar reasons that caused U.S. housing bubble in 2004. Bubbles typically experience mania phases during the maturity stages of their life-cycles because investors and other participants become overconfident and extrapolate continued growth very far into the future after an already long period of steady growth such as the decade-long period of growth that housing had already experienced by 2004. After a long boom, many participants develop cult-like attitudes and display thinking patterns such as, “housing prices never go down!” or “people will always need healthcare and prices only go up, up, up!”
This chart shows the typical psychological stages of bubbles:
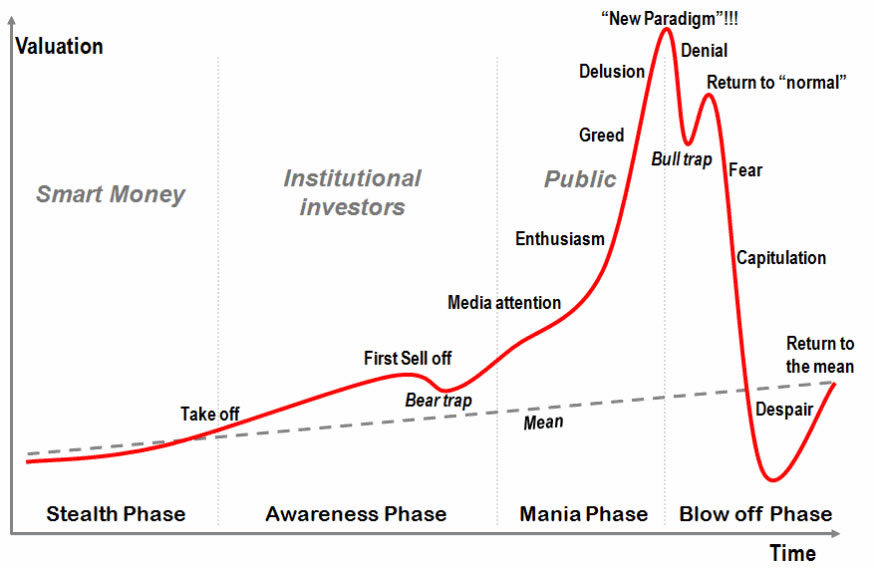
(See the “First Sell Off” stage in the chart above? There’s a very strong possibility that this stage corresponds to the Great Recession sell-off and recovery from 2007-2011.)
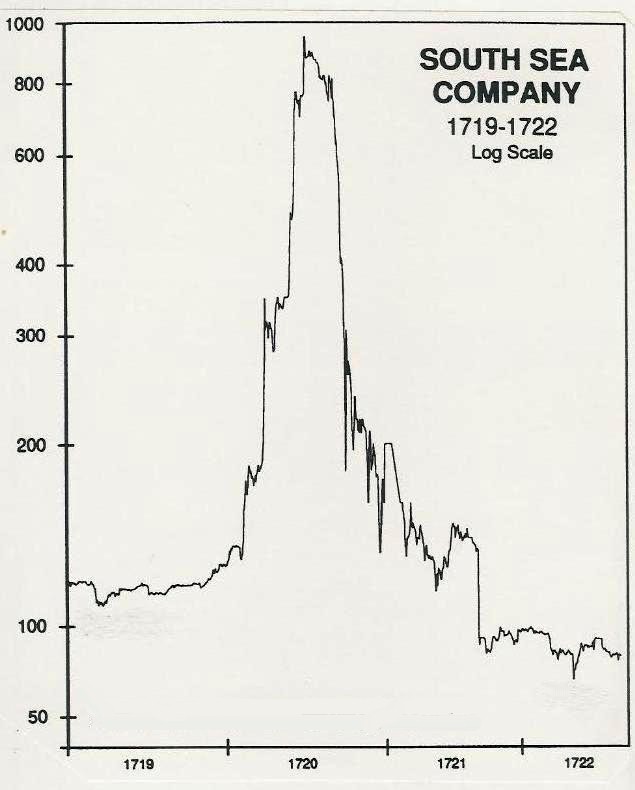
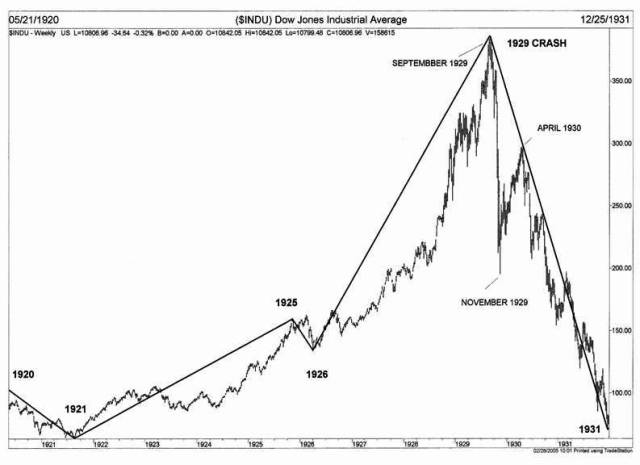
This classic “last hurrah” mania pattern can be clearly seen in historic bubbles such as the Dutch tulip bulb bubble in the 1600s, the early 1700s South Sea Bubble (in which Isaac Newton lost his fortune), the Roaring Twenties bubble that led to the Great Depression, Japan’s 1980s bubble (that they are still suffering from the effects of) and the infamous Dot-com bubble. Bubbles don’t end with a whimper but with a bang and the “CCC Aches” bubbles haven’t experienced their bang yet.
Extremely Stimulative Monetary Conditions: Rocket Fuel Waiting for a Spark
Right now, the “CCC Aches” bubbles are similar to a rocket that is loaded with fuel and is sitting on its launch pad waiting for ignition. The rocket fuel in this analogy is the extremely stimulative monetary conditions that have been created out of desperation by the world’s central banks to prevent the global economy from experiencing an economic collapse and depression. While both the rocket and the “CCC Aches” bubbles are filled with incredible amounts of potential energy, so far they’ve lacked the “spark” needed to convert their potential energy into kinetic energy and send the rocket and the bubbles into orbit. I will talk about potential “sparks” shortly, but let’s first examine the monetary “rocket fuel” in greater detail.
Since the Global Financial Crisis started in 2007, global central banks have pursued a very aggressive combination of conventional and unconventional monetary policies. Conventional monetary policy, in the form of interest rate reductions, was pursued by most major central banks, with the U.S. Federal Reserve cutting rates from 5.25% to effectively 0% (called Zero Interest Rate Policy or ZIRP), the European Central Bank cutting from 4.25% to 1%, the Bank of England cutting from 5.75% to .5% and the Bank of Japan holding interest rates at .1% after fighting deflation for nearly a decade. In addition to aggressive interest rate cuts, central banks pursued emergency unconventional monetary policy in the form of quantitative easing, which entails central banks creating (or electronically “printing”) new money to purchase securities such as bonds from banks and financial institutions for the purpose of increasing the money supply and adding liquidity to the financial system. As of early 2012, the U.S. Federal Reserve pursued a total quantitative easing program of just over $2 trillion in addition to the Bank of England’s $514 billion and the Bank of Japan’s $670 billion. Though not technically a form of quantitative easing, the European Central Bank launched an emergency lending program in December 2011 called LTRO (Long Term Refinancing Operation), which loaned approximately €1 trillion to European banks for three years at 1% under the assumption that the participating banks would buy their own countries’ sovereign debt in addition to pursuing other profitable activities called “carry trades.”
The primary goal of these aggressive monetary policies is to jump-start lending and economic activity again but the economies of the U.S., Europe, U.K. and Japan remain firmly in a deep-freeze as overindebted consumers, banks and other institutions are reluctant to borrow or lend at such a risky time with so few good opportunities, while deleveraging or paying down debt has been the name of the game in recent years. When the quantitative easing programs first launched in 2008 and again in 2010, they sparked fears of imminent currency meltdowns caused by “money printing” and evoked images of Weimar Germany’s hyperinflation, when people pushed around wheelbarrows filled with worthless currency. Far from creating hyperinflation or even being used to create loans, the newly-created money has mostly been deposited with central banks for safe-keeping in the form of “excess reserves,” earning paltry interest rates such as the .25% per year paid by the Federal Reserve.
Here’s a chart of the newly-created money sitting with the Federal Reserve as excess reserves:
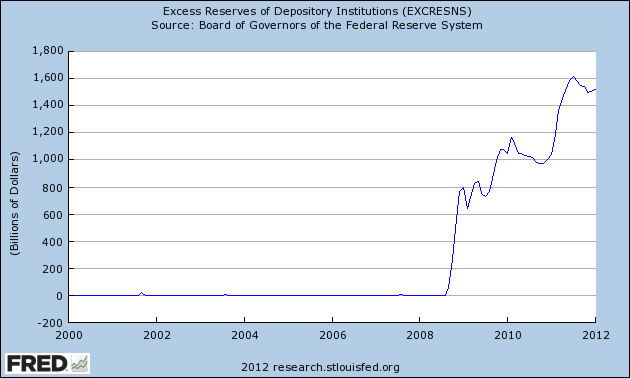
Chart Source: St. Louis Fed
As additional proof of an economic deep-freeze, the sharp reduction in borrowing and lending activity coupled with newfound frugal tendencies in countries that were hit hard by the Great Recession has resulted in a plunge in the velocity of money or the rate at which money changes hands:
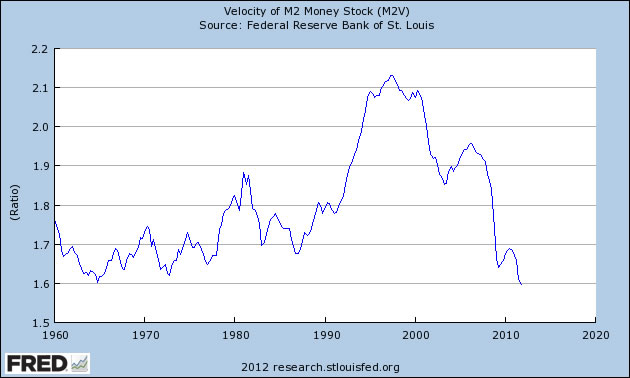
Chart Source: St. Louis Fed
As long as economic fear rules the day, banks will continue hording cash and parking it with central banks for safe-keeping while earning miniscule rates of return. The trillions of dollars worth of liquidity will remain in the form of potential energy until there is source of ignition to light the proverbial rocket fuel and send the “CCC Aches” bubbles into orbit. While the trillions of dollars of liquidity are impressive in their own right, it is even more potentially explosive than it first appears due to modern monetary systems’ practice of fractional reserve banking. Fractional reserve banking is a system where only a fraction of bank deposits are backed by actual cash-on-hand and are available for withdrawal. An initial deposit of $100 can eventually result in the creation of $900 in loans, a process that leads to a dramatic increase in the money supply and can spark economic bubble booms and inflation. In our current situation, the trillions of dollars of idle liquidity is equivalent to the $100 in the prior example and both are considered to be “base money” or “high-powered money” due to their ability to create a quantity of loans well in excess of the initial deposit amounts. Quantitative easing in the U.S. alone resulted in the creation of $2 trillion of high-powered base money, which can further multiply into an astronomical $18 trillion of new loans.
Total U.S. base money and time deposits (up an incredible 37% since 2008):
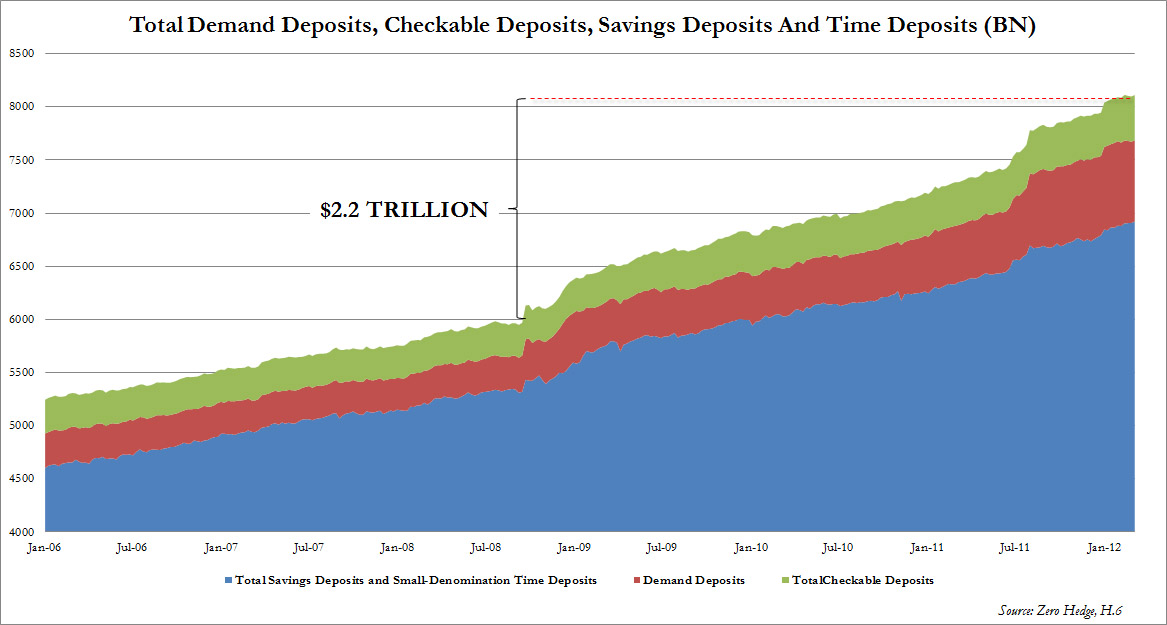
Chart Source: ZeroHedge
Growth rate of cash accumulated by U.S. corporations:
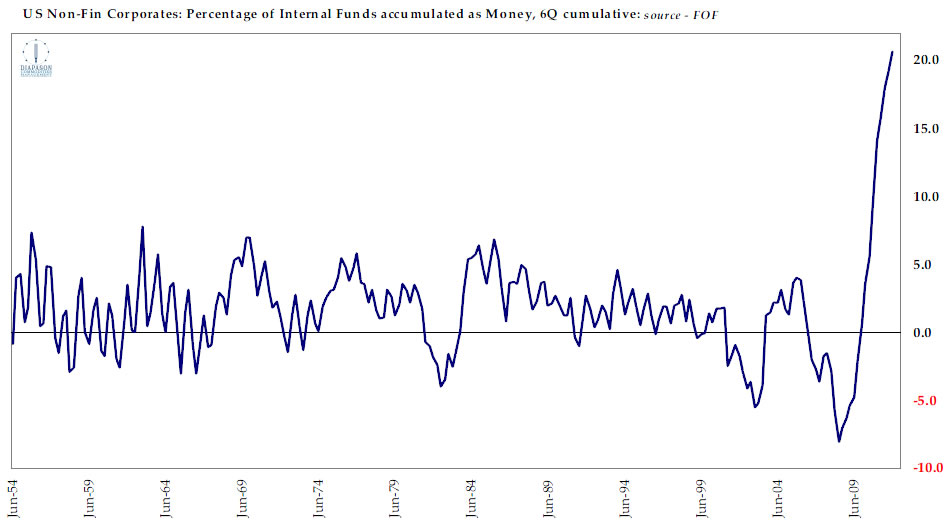
When factoring in the U.S.’s $8.1 trillion in total base money and time deposits, including record quantities of cash held by U.S. corporations, and other countries’ quantitative easing programs and idle base money, it becomes clear that there are potentially tens of trillions of dollars worth of new loans that can be created as soon as economic sentiment thaws. The process of economic thawing and loan creation will start slowly but can rapidly accelerate as the expanding money supply causes rising asset prices, a rise in money velocity and a sharp uptick in economic activity and job creation (of course, this economic activity will be due to expanding liquidity-fueled bubbles rather than organic economic growth).
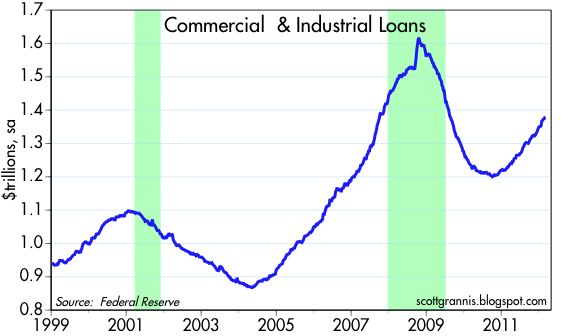
There are already signs that commercial and industrial loan growth has picked up since the beginning of 2011:
Another bubble boom is a very high probability event because central banks’ unprecedentedly stimulative monetary policies virtually guarantees that it will happen. Due to their desperation to avoid a potential depression, central banks will hold interest rates at extremely low levels for as long as is necessary until economic growth and job creation returns, regardless of whether the growth materializes in the form of sustainable development or economic bubbles. The Federal Reserve alone has promised to keep interest rates at extremely low levels until at least late 2014, providing plenty of monetary fuel and time for a bubble boom to develop. Given such a situation, virtually any already fast-growing industry or economic trend can develop into a bubble as cheap credit is attracted like a magnet to the profit opportunities, resulting in a surge in artificial business activity and euphoria. The U.S. housing bubble followed this pattern when the already strong underlying trend of rising housing prices and investor activity experienced a powerful amplification when coupled with the Federal Reserve’s stimulative monetary policies. Similarly, all of the “CCC Aches” bubbles have continued growing throughout the Great Recession and may be about to experience their credit-fueled amplification if the global economy continues to thaw and maintain its positive momentum.
If a credit-fueled bubble boom does occur, the resulting surge in economic growth will surely surprise the vast majority of people, including most economists and financial professionals. People in the bearish camp, a huge group these days, would clearly be the most surprised by a bubble boom as they typically envision either a 1929-style deflationary meltdown ahead or a quantitative easing-induced hyperinflationary holocaust – both of which are scenarios in which economic growth dives off a cliff. On the contrary, the initial stages of a credit-fueled bubble boom are likely to bring about feelings of relief as stock prices soar, jobs come back (in bubble-related areas) and economic data marches steadily higher. While the surge in stock prices and economic activity will be driven by bubbles, few people will recognize this fact and simply questioning the bubble boom may elicit harsh reactions by a public (including politicians) that is so grateful for the newfound economic growth and basking in feelings that “happy times are here again!”
Because the bubble boom would be fueled by an expanding money supply due to a surge in lending, economic growth and rising asset prices would be accompanied by a rising rate of inflation. There is an element of truth to the assertions of people in the “quantitative easing causes hyperinflation” camp – the big difference is that the inflation may occur as a side-effect of euphoric economic boom times rather than an economic and currency meltdown. The 2002-2008 global bubble boom, which included the U.S. housing bubble, led to soaring commodities prices and high rates of inflation – even though most consumers saw a reduction in their purchasing power due to inflation, it was masked by an improving economy and soaring investment values. Murray Rothbard describes this phenomenon perfectly in his book “What Has Government Done to Our Money?,” saying that inflation “lowers the general standard of living in the very course of creating a tinsel atmosphere of ‘prosperity.’” The important elements needed to fuel a bubble boom are already present – all that is missing is the source of ignition.
The conditions needed to ignite the bubble boom may be quite simple: a long enough period of benign to positive economic data (some of which may be due to already-expanding bubbles) and rising stock prices. Though European and emerging market economies have struggled since mid-2011, the United States’ economy may have entered a period of sustained employment growth, with over 100,000 jobs created each month since September 2011 and over 200,000 jobs created per month from December 2011 to February 2012. While the March 2012 employment report showed a lower than expected gain of 120,000 jobs, it is still a step in the right direction. In addition, initial jobless claims have hit a new 4-year low, helping to bring the unemployment rate down to 8.2% from a peak of 9.9% (there is still a low labor force participation rate and a large number of involuntary part-time and underemployed workers, however). U.S. corporate profits are steadily trending higher and hitting all-time highs, after growing 99 percent between the end of 2009 and 2011, and are forecast to rise another 12 percent this year and 13 percent next year. While housing prices continue to slowly deflate, there is a nascent boom in multi-family home construction activity, which is up 60% since February 2011 as renting becomes more popular again and even single-family home construction permits are up a healthy 24%.
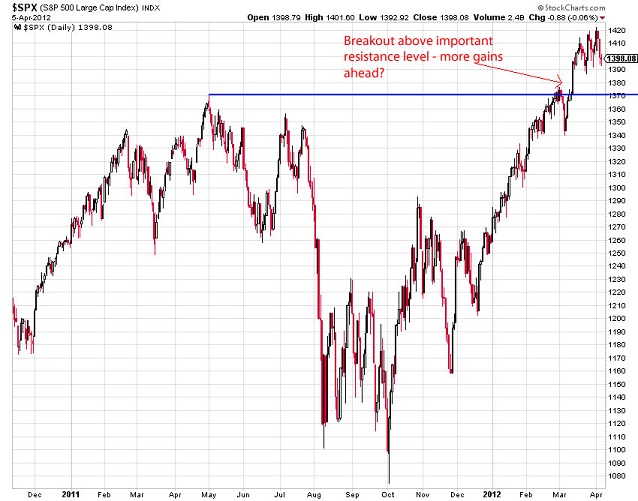
Even though economic data is slowly but steadily improving, what may be even more important to watch is the rise in the stock market, which tends to be a leading indicator of future economic conditions. The S&P500 is up nearly 30% from its October 2011 lows and recently broke above its 2011 highs (an important prior technical resistance level) to hit levels not seen since early 2008:
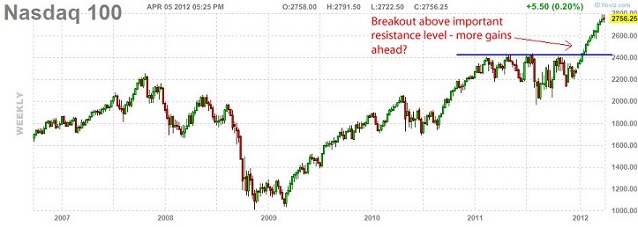
Both the Nasdaq Composite and Nasdaq-100 indices have recently soared above their crucial 2011 and even 2008 highs to hit levels not seen since the Dot-com bubble era 11-years ago:
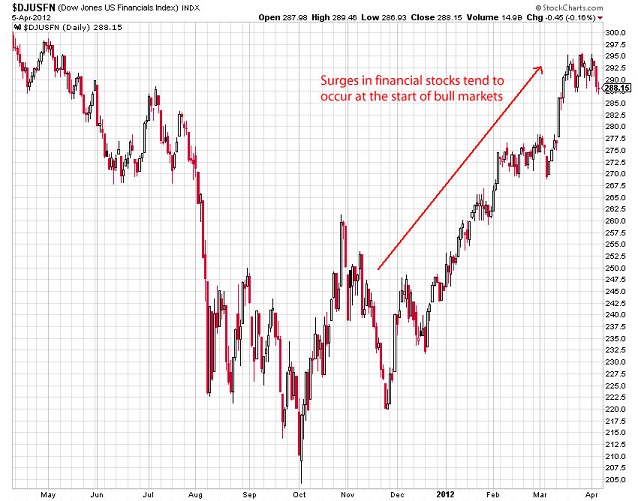
Financial stocks are surging, which is a positive sign as they tend to lead the overall stock market:
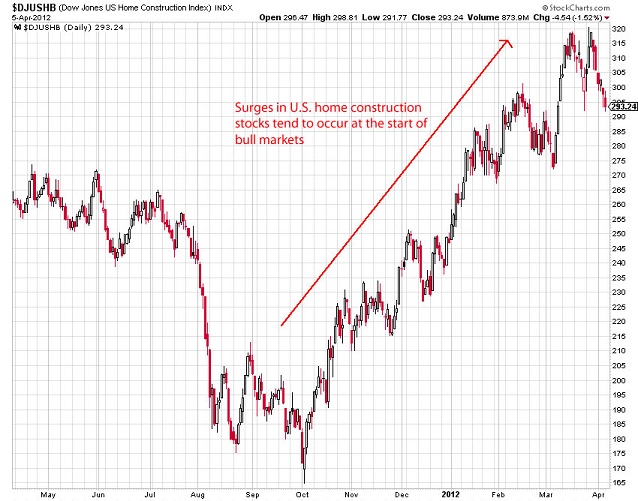
Home construction stocks are also surging, which is a positive sign as they tend to lead the overall stock market:
The strong rise in the stock market may be an indication of an improving economic picture ahead, even if partly due to a stock market-induced “wealth effect.”
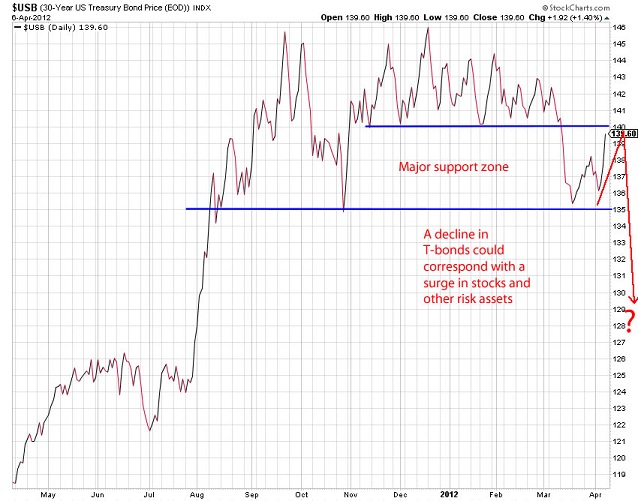
U.S. Treasury bonds have broken below a key technical support level as signs of economic thawing and rising inflation expectations are coaxing bonds to come down from their panic-induced heights:
Within the last two years, taxable bond mutual funds have received an incredible net inflow of $366.7 billion while equity mutual funds saw a net outflow of $167 billion. If the trend of economic thawing and rising stocks continues, it is conceivable that large quantities of capital will flow out of bonds and into more aggressive investments such as stocks. Rising longer-term interest rates, triggered by falling bond prices, will boost bank profits and their stock prices because banks borrow at low short-term rates and lend at higher long-term rates, earning the difference. Small and large investors alike may soon be forced to play a game of “catch up” to make up for lost gains after being underinvested for the last several years, helping to further boost the market. There is strong reason to believe that stocks can rise significantly higher, as they are now the cheapest they have ever been since 1989, especially considering today’s record low interest rate environment. In addition, major corporations, which are now sitting on a $2 trillion cash hoard, will be encouraged to expand and invest (including buyouts) more freely if the stock market stays stable and continues to rise. A good portion of corporations’ cash may also start finding its way into investors’ hands via share buybacks and dividends, a trend that would certainly spark demand for stocks.
Though the implementations of quantitative easing in 2009 and 2010 caused immediate rallies in stocks and other risk assets, the initial reaction may have been more psychologically-driven rather than monetarily-driven. Most people confuse the true effects of QE with the immediate rallies that occur after its implementation – this is a short-sighted understanding of how these programs work. It is important to understand that monetary policy often works in a delayed manner – for example, U.S. monetary policy became unusually expansive around 1965, whereas inflation did not hit 5 percent a year until 1969 and only topped 10 percent in 1974. The true effects of the QE programs have barely been felt yet but when these monetary effects of QE kick-in, it will likely put the initial QE-reaction rallies to shame.
A bullish argument, according to contrarian logic, can also be found in the widespread skepticism and pessimism toward the recent stock market rally, in addition to the rally that started in March 2009. Though anecdotal, there have been an incredible number of recent articles and blog posts that have expressed downright disbelief of the bull market’s sustainability, with many articles written on themes such as “The Market Top is In!” and “Prepare for China’s Hard Landing!”
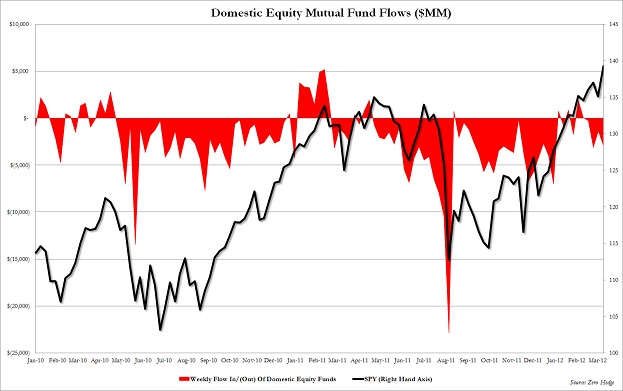
In addition, the investing public, who are typically wrong in their expectation of market direction, have continued to sell stocks (in favor of bonds) even as the market has continued to rally:
Bull markets typically climb “a wall of worry” and, sure enough, there has been an explosion in the mainstream popularity and numbers of bearish financial pundits and alternative media since 2008, while the stock market has continued rallying all along and defying all expectations of a crash. Many of the arguments of bearish pundits are indeed technically correct but they lack the awareness of the currently-expanding bubbles and their power to create temporary economic growth and cause financial markets to rise.
The recent mainstream popularity and appeal of bearish alternative media may actually be contributing to the bullish wall of worry effect as bearish and cynical market viewpoints become so commonplace that they may already be reflected in stock prices. It was truly contrarian to be bearish during the 2004-2008 period but, since 2009 and especially since the Summer 2011 crash, having a (shorter & intermediate-term) bearish outlook is no longer cutting-edge as there is plenty of company in that camp. On the contrary, having a short and intermediate-term bullish outlook (due to awareness of growing bubbles but also realizing that the bubbles will eventually pop disastrously) may now be the most contrarian stance of all. The stock market may keep rallying for as long as bearish alternative media is still very popular, eventually resulting in a severe reduction in credibility and popularity of such media as investors grow weary of what they perceive to be crying “wolf!” i.e. constantly warning of the supposed “next financial crisis” that never seems to materialize while missing out on lucrative bull market opportunities. Many people in the bearish camp will throw in the towel as bubble-induced euphoria sets in, ironically setting the stage for the ultimate crash, but only after bearishness becomes contrarian once again.
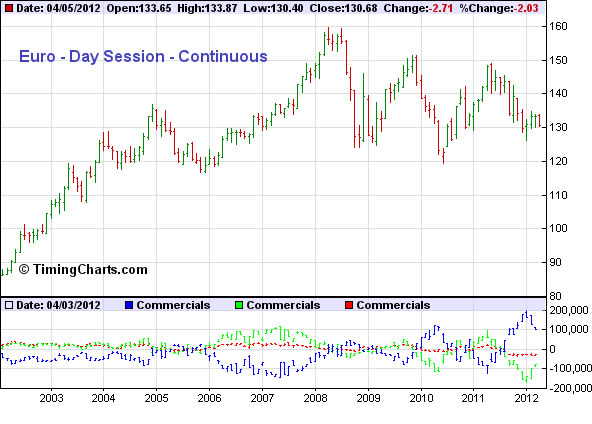
Another possible catalyst for a bullish surge in stocks and risk assets is the record short positions against the euro currency in the futures markets. The euro is strongly correlated with stocks and other risk assets and a surge in one market will often trigger a surge in the other due to trading programs that arbitrage the two markets and help reinforce the correlation. Most of the euro rallies in the chart below correspond with a surge in stocks and vice versa. Since mid-2011, record euro short positions have been held by groups of traders who are typically behind the curve (the green & red below represent short positions of funds and smaller traders, respectively), while record long positions have been held by commercial hedgers or the “smart money” (blue), who have tended to accumulate aggressive long positions right before significant rallies in the euro. The record short positions against the euro represent extreme negative sentiment on the part of the “dumb money” toward the euro and other risk assets and can be viewed in a contrarian bullish manner. If the positive overall market trend continues, the euro short positions may be forcibly unwound, causing the euro and other risk assets to rise very strongly.
A rallying stock market can do wonders for improving economic sentiment for obvious psychological reasons and because it adds trillions of dollars to the net worths of households and institutions around the world, reducing measures of financial stress. Pension funds won’t be nearly as unfunded after a bull market in stocks. A strong stock market rally will also spur consumer spending, even if the effect is initially concentrated among the more affluent demographics who own a disproportionate share of U.S. stock market assets as this group is also responsible for a disproportionate share of consumer spending. A rallying stock market will also jumpstart venture capital and IPO activity, boosting the fortunes of venture capital firms and investments banks. These are just some of the numerous reasons why a surging stock market may be the initial catalyst needed to help the economy escape its current deep-freeze as money velocity and lending activity rise, kicking off the next explosive phase of the “CCC Aches” bubble boom. Another important ingredient that may help usher in the bubble boom is time – the more time that elapses since the meltdown of 2008, the less fresh the public’s memory of the crisis will be, helping to steadily increase risk appetites as a function of time.
(Note: Even if the current U.S. stock market rally and improvement in economic data mentioned in this section of the report runs into turbulence, which it very well may, it doesn’t necessarily invalidate the theory that a bubble boom may be ahead. If the economy stumbles on the road to recovery, such as how the U.S. economy did in the summer of 2010, central banks will simply intervene with more quantitative easing or other forms of monetary stimulus until the recovery finally becomes self-sustaining.)
Continued on Page 2
(I discuss the individual "CCC Aches" bubbles in great detail and how the bubble boom will
end and lead to the next economic depression)